Logging as a First Class Citizen
TL;DR How to log with a Whole Product Concern
When I started getting serious about programming, I was indoctrinated into leading edge development methods for X Windows and C like PDD: Printf Driven Development. While you were trying to figure out how your code worked, you would litter the code with printf statements, run it, read the log, revise the code. By convention, you left the printf’s in place to simplify future feature additions and so you could find and resolve bugs if they were ever reported.
X Windows? C? Yeah, the world has changed a lot in 25 years. New languages, platforms, and even modern incarnations of ancient languages have amazing tooling, debugging, robust logging frameworks, and support BDD and TDD. In the Enterprise, BDD and TDD are pervasive and change the emphasis from “get ‘r done” to improving how you can reason about your code. Moving to the cloud implies moving to small DevOps oriented teams and a whole product concern. BDD, TDD are essential methods for improving your ability to reason about your code, and their artifacts are used to prove initial code and that code’s evolution.
What role does logging play in this new environment?
What’s up in production?
Our testing frameworks help us develop code and prove it on every commit via CI, and then prior to each release with CD. Debuggers reveal the inner workings of our code in unexpected situations. This eliminates some of the traditional needs for logging so the question remains: what is logging’s role in a DevOps focused environment?
Enterprise wisdom tells us that 90% of the life of a product happens after initial release. While code is in a production environment, logging will be one of four ways we can evaluate the health of the product:
- Application/Service historical trending and application diaries produced in logs and aggregated by infrastructure like Splunk, Graylog, and the ELK stack.
- Application/Service metrics generated with frameworks like Spring Boot Actuator and Strongloop, more metrics produced by cluster managers like Kubernetes, and all of that collected and displayed with products like Prometheus.
- Execution environment monitoring with products like Prometheus.
- Interprocess request tracing with products like Zipkin
There is some necessary overlap between /metrics and logging. /metrics provide a snapshot of your code with counters and guages, collected on some short period, and Prometheus provides a way to organize those snapshots in meaningful views. Log based metrics provide a more wholistic view of more granular information in a way that is easily aggregated and analyzed.
For example, in /metrics, you have guages that show last api call duration, but how do you see averages, 90th and 10th percentiles, and outliers? Providing this kind of post-mortem, ad hoc query and producing actionable analysis justifies the double data recording in /metrics and logging. If you are overly concerned with, or culpable for, product quality, you will appreciate this value.
When choosing one of several logging frameworks for your environment, the key factor is how easily you can produce log entries that are efficiently and effectively ingested by your logging aggregator.
Once that choice is made, the focus turns to what should be logged.
Narrowing logging’s purpose
Given the wealth of information aleady available from other systems, how can logging improve our knowledge of our production system? Logging’s unique contribution addresses two operational concerns:
- Historical trending
- Issue remediation
Historical trending uses API call counts, durations, and response status to answer questions like:
- Capacity planning
- How does application use vary during the day, week, month, quarter, seasonally
- What rate is my application use increasing
- Do I need to scale for periodic peak use
- When will I need to scale based on application use forcasts
- Load based problem analysis
- Do some problems only occur under load
- What services are my weakest links and need some love
- What interdependencies exist that contribute to load based problems
- Performance analysis
- Does call duration increase under load
- What load should benchmarks and load testing simulate
- What code should change to improve UX
Narrative log entries read like a diary of actions taken to accomplish a task. These are vital to reproducing production issues in a development environment and rapid remediation. Some key goals for these types of entries are:
- Log API request params so you can replicate an API call locally
- Log significant branching decisions and values used to make those decisions
- Log out of process calls. If that process is not monitored by your log aggregator, request params, call duration, and response status should be logged to provide a more complete task view.
What should I be logging?
Logging should be minimal, yet meet the above goals.
If you are paying for a logging service like Loggly, or infrastructure like Splunk, those costs are based on how much you log. Minimal logging can save you some money.
No matter what log aggregator you use, there is a cap on how much disk you can use. Minimal logging lets you keep logs for a longer time. Want a year’s worth of historical trending? Minimize your logs.
Then there is the question of clarity. When you are under the gun to resolve a production issue, you don’t want to have to wade through a lot of clutter to find what is important.
Distilling logging goals above, this is what you should be logging:
- On API entry, log request and header parameters so you can easily reproduce the call in a dev environment
- On API exit, log call duration and status to easily identify long running calls and error frequency by type
- Log every branching decision and the data used to make that decision
- Log calls to other service and capture parameters, call duration, and status if that service does not log to your aggregator
- Log other data not captured in
/metricsthat may result in actionable analysis
See below for framework generated log data - essential tagging for queries that you won’t have to add to your log messages.
Log with the aggregator in mind
All aggregators ingest JSON encoded data most effectively. Some may claim they can parse XML but that never works well. Some will talk about extracting values from narrative messages, and while true, it is so inefficient as to be unusable with larger datasets. What happens? Spinning wheel of death when you apply a regex to a month of logs.
Tell you more about inefficiently encoded data? On Splunk, you define the number of concurrent jobs permitted, defaults to 8. If you designed a dashboard based on regex extracted values, and you have a production problem, and 8 managers open the dashboard, you just locked every engineer out of doing real work with Splunk. And not just your team; every team that uses that Splunk repo. Sure you could increase the concurrent job count, but that just defers the inevitable. The point is that you are doing something so ineffeciently that you WILL choke the system. Not bashing Splunk here - it is my favorite log aggregator so far. So, on the importance of JSON encoded log messages: Got it? JSON formatted data GOOD. Extracting values from strings BAD.
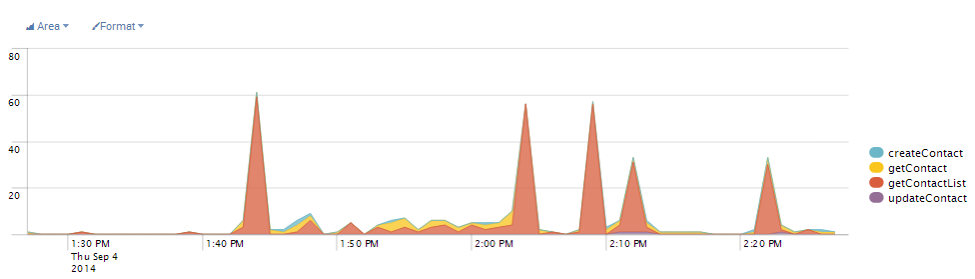
After you have all logging statements as key-value pairs, there is still a little more work to do. If you think back to the kinds of questions we want to answer, how would you write a query for “Show call counts for all API methods by name”? This is a great basic query. Your log aggregator can produce a pie chart from it showing heaviest use and hinting at who should be optimized first. It can also provide time rollups and show how comparative values vary over time. In Splunk, with well formatted data, I can write an eight word query and produce this dashboard in 6 clicks.
The key to writing this query is: how do I identify API method names and how do I identify API entry points.
- API method names should be logged by your logging framework
- Use tags to allow you to ‘group by’
In the past, I have used a tag executionPoint=request to mark an API entry point and executionPoint=response to mark an exit. This small addition allows the log aggregator to both exclude irrelevant log entries, drammatically improving performancem and group by these fields improving the quality of the dashboards you write.
What should the framework be logging?
Just for completeness, let’s explore what your logging framework should be logging for you and why it is important.
Logback in combination with the logstash-logback-encoder is the emerging standard when your logging focus becomes the log management system. This is what an easily ingestible logging pattern looks like:
%d{yyyy-MM-dd'T'HH:mm:ss.SSSZZZ} "logLevel":"%p", "logThreadId":"%t", "logClass":"%C", "logMethod":"%M", %msg%n
Note that these are all comma delimited, key-value pairs except the first and last. Also note that each key has a log prefix to reduce the possiblity of key name collisions in entries in your application code.
The first entry is special, it is an ISO8601 compliant date-time format including timezone. Using this format allows you to effectively integrate logs across the globe and your log aggregator bears the responsibility of rendering that time in the local zone and format.
The logLevel entry includes things like DEBUG, INFO, WARN, ERROR and allows you to turn up or down logging verbosity to support issue remediation. Every environment should log at INFO level: these are your narrative diary entries. The WARN and ERROR tags make it easy to find suspicious entries, things that need attention. DEBUG entries are for emergencies; when you can’t reproduce the problem in DEV and can’t understand what is going on in PRODUCTION.
The logThreadId entry can reveal a different side of the story in thread based systems like Java. With it, I can locate the thread id with data provided in a bug report and then show all actions that occurred on that thread.
logClass and logMethod are a coordinate system allowing you to quickly locate the logged line of code. They also allow efficient queries when you want a horizontal slice (across all threads) of all method invocations.
%msg is the application portion of the message. Each message logged by the application should be JSON encoded, including the logMessage. Keeping the narrative message in a k-v pair allows you to easily create a query in the log aggregator that lists only the timestamp and log message - great readability when you want to focus on what was going on in your code by hiding all the detail that allows creating great dashboards.
Concrete example:
2016-03-12T03:51:01.577-0700 "logLevel":"INFO", "logThreadId"="http-nio-8080-exec-1",
"logClass"="com.github.stevetarver.controller.ContactsController", "logMethod"="get",
"executionPoint":"request","contact": {"id":5,"firstName":"Donette","lastName":"Foller",
"companyName":"Printing Dimensions","address":"34 Center St","city":"Hamilton",
"county":"Butler","state":"OH","zip":"45011","phone1":"513-570-1893","phone2":"513-549-4561",
"email":"donette.foller@cox.net","website":"http://www.printingdimensions.com"}, "logMessage":"Getting contact 5"
Wow, that is pretty ugly. But that message is not for you, it is for the log aggregator. Logback allows you to have an entirely different, human readable, logging pattern in logback-test.xml that will be used during test development.
What do log entries look like in code?
Guidance: Log in JSON, log parameters first, and then provide a narrative message for more context.
Every object should have a toString() that emits a JSON object.
    @Override
    public String toString() {
        return (new Gson()).toJson(this);
    }
I’m sure you are already thinking about how to improve performance here (like making a static Gson member in a common base class).
The logstash-logback-encoder library provides Markers that can help clean up your code while appending proper JSON to your log message.
import static net.logstash.logback.marker.Markers.*;
...
    log.info(append("contact", contact)
            .and(append("logMessage", "Creating Contact")),
            "");
12 factor guidance
I have a lotta love for Twelve-Factor Apps. I have experienced all the pain points they describe and get all the guidance they provide. Here is what Heroku says about Logging.
Briefly:
- log to stdout and let the execution framework send it to the log aggregator
And this is what Steve says:
- log to persistent storage for reliability - kafka, rabbitmq, etc. Your log aggregator reads from your persistent store.
- use a log guid header to track operations from app to middleware and then among collaborating microservices
- use an environment trace monitor like zipkin if you can
Mask sensitive information
Got passwords, SSNs, other sensitive data? Instead of relying on all application code to mask these entries, create a logstash filter in your execution environment as a single place that ensures the job gets done.
More on levels
Some systems have an abundance of logging levels. At some point this made sense, but in modern 12-factor apps, not so much. IMHO, this is what you need.
- DEBUG is for excessive detail targeted at resolving complex, possibly opaque areas
- INFO is for API boundary entry and exit. log the inbound parameters and headers (Referer, User-Agent, X-Forwarded-For, as well as meaningful custom headers) so if there is a bug, you can easily reproduce it. On exit, log the call duration and status. INFO is also used for narrative entries that should read like a book describing all significant actions or branching decicisions taken during the execution of a task. You should also log calls to other modules.
- WARN for conditions that should be looked at but did not cause task failure
- ERROR for failed tasks
Security
Log renderers are not immune from security breaches: forged logs, and XSS attacks. Here are some things to consider:
- CRLF injection via user supplied data: protect by ouput encoding using
ESAPI.encoder().encodeForHTML(<string>) - Log Forging Attack: If it can be proved that a log has been altered, then the entire log file is suspect and cannot be trusted. If a user can supply data that adds log entries, through injected CRLF, your log as a record has been invalidated.
- XSS attacks: If a user can embed code in your logs, and your log renderer presents that code, what happens when a user clicks on a generated link?
Epilog
A lot changes when your app scales or your fleet of applications/services grow. You incorporate a centralized log management system and the most important use of logging is business intelligence and operational support.
Supporting those concerns means rethinking technology choices and logging habits so ingrained that you may never give them a second thought. I hope this article fast-tracks you in your pursuit of excellence.