Structured logging in Python
TL;DR A python logging configuration for humans and computers
![]()
Structured logging encodes log entries as key-value pairs, frequently as JSON, and is essential for efficient log ingestion by aggregators like ELK, graylog, and Splunk. Intentionally separating message from associated data allows you to efficiently find log entries by name, location, or any other data you expose; each key becomes a group-by target. It also clarifies the log message so you can quickly scan what was going on and then drill down into the data when needed.
Good logging reduces operational cost and operator frustration. Good logging is also complex and requires a considered approach and an effective implementation. When developing your considered approach, see Logging as a First Class Citizen for some basic ideas.
We will be tackling an effective implementation today in Python. First, we have to define what is an effective implementation. These goals come to mind:
- It should be convenient to use for both humans (reading) and computers (ingesting).
- It should be easy enough to use that all developers will use it.
- It should make as many entries as possible for you to clean up code and eliminate tedious boilerplate.
- It should fill in as much of the log entry as possible to simplify log code and eliminate tedious boilerplate.
Output is king!
The first, and primary, goal is that logging improves developer joy while still addressing logging system requirements (efficient ingestion). On the surface, these two needs seem fundamentally opposed: things that are easy to read are difficult to parse and vice versa. But structured logging turns lines of text into data and each need is simply a different presentation of that data.
Developer joy? Really? All of us are used to visually parsing log streams during development and it is tedious. But what if your log output looked like this:
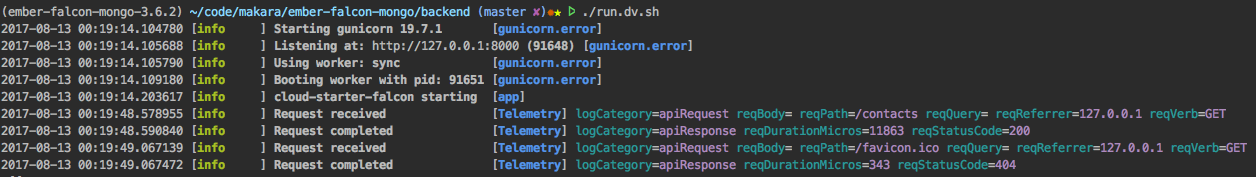
Perhaps I am just especially geeky, but, that just makes me happy when I look at it. It is such an improvement over logging in previous years.
To make the logging system happy, we need an encoding like this:
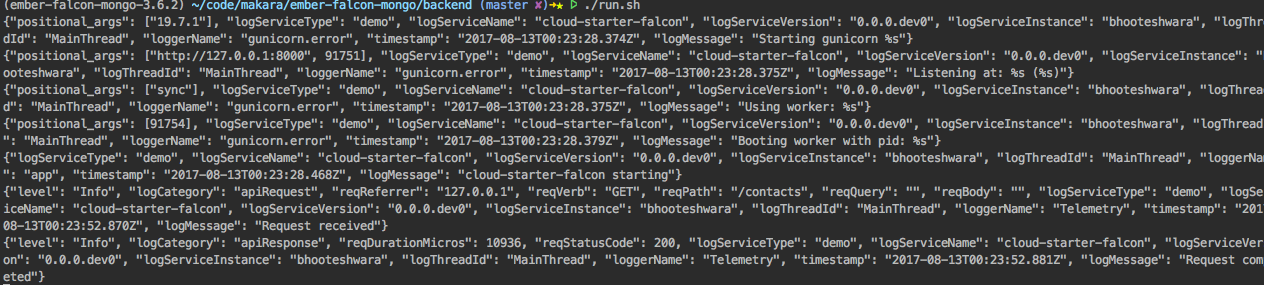
Clearly, you don’t want to have to wade through this to read test output, debug, or really ever. It is worse than old-school logging. But we don’t care because we will never have to look at it. We have our beautiful developer display above, and our logging system will turn this JSON mess into something pleasant in production.
Where to start?
All implementations start with a good logging library, and then add a little configuration and customization. All modern languages have good support for structured logging and in Python the king is structlog.
We’ll be developing this solution in the ember-falcon-mongo repo. Using that repo’s pip strategy, installation is straight-forward:
requirements.txt:structlogrequirements-dv.txt:coloramaconstraints.txt:structlog==17.2.0
And then pip install -r requirements-dv.txt.
Is logging with structlog different than with the stdlib?
The way that you log with structlog changes slightly from conventions in the stdlib logging package. The first arg is the message and *args and **kwargs are just different ways of providing key value pairs.
If you have some old style logging statements that will use *args as substituion values like one of these:
self._info('Health server listening at: %s', self._server.url)
self._info('Health server listening at: {0}', self._server.url)
the additional parameters will show under key positional_args in the log entry instead of being inserted into the log message. Sometimes these args are just dropped - depending on configuration.
Your log message should be the first argument using ““.format()
self._info('Health server listening at: {}'.format(self._server.url))
Next, you should change the way you think about logging. All data should be extracted from the message unless it clarifies the message.
Furthermore, each key in the log entry is a potential SQL-like column; a group-by target. These can be used in the log aggregator to find all messages by service name, by tracing id, or any other keys that you provide. Give some thought to what questions you will ask of the logging system to help define what keys you should add. These are frequently good addition to your logging’s boilerplate entries.
In structlog, you add key-value pairs to the log entry by simply adding key-value pairs to your log entry:
self._info("Indexing completed", count=165234, failures=23, duration=22343)
Finally, exceptions are a bit different. If you want a stack trace in the log entry, add a k-v pair named exc_info with the exception as a value.
You may want to add the type of exception to the message, which is retreived in the standard way:
type(ex).__name__
Putting these two ideas together, you can show the exception type, msg, and traceback with something like:
self._error("During shutdown, worker raised {}: {}".format(type(exc).__name__, exc), exc_info=exc)
That’s all you need to know to get started. You can find all the gory details in the structlog doc.
Configuring structlog
structlog effectively wraps the stdlib logging package and requires a boilerplate logging configuration.
def initialize_logging() -> None:
    debug = os.environ.get('DEBUG', 'false') != 'false'
    logging.basicConfig(level='DEBUG' if debug else 'INFO',
                        stream=sys.stdout,
                        format="%(message)s")
To configure structlog itself, we need two structlog configurations, one for developer use and a second for production logging. We will use production as the default and enable the developer presentation if LOG_MODE=LOCAL.
    if os.getenv('LOG_MODE', 'JSON') == 'LOCAL':
        chain = [
            structlog.stdlib.add_log_level,
            structlog.stdlib.add_logger_name,
            structlog.stdlib.PositionalArgumentsFormatter(),
            structlog.processors.TimeStamper(fmt="%Y-%m-%d %H:%M:%S.%f"),
            structlog.processors.StackInfoRenderer(),
            structlog.processors.format_exc_info,
            structlog.dev.ConsoleRenderer()
        ]
    else:
        chain = [
            LogEntryProcessor.add_app_info,
            LogEntryProcessor.add_logger_name,
            LogEntryProcessor.add_timestamp,
            LogEntryProcessor.censor_password,
            structlog.processors.StackInfoRenderer(),
            structlog.processors.format_exc_info,
            LogEntryProcessor.cleanup_keynames,
            structlog.processors.JSONRenderer()
        ]

    structlog.configure_once(
        processors=chain,
        context_class=dict,
        logger_factory=structlog.stdlib.LoggerFactory(),
        wrapper_class=structlog.stdlib.BoundLogger,
        cache_logger_on_first_use=True,
    )
This configuration highlights one of the great powers of structlog: the processor chain. When a log entry is created, it is passed through each processor in the processor chain. structlog provides a nice handful, but we can also easily add our own.
Notice that the developer view uses all structlog facilities and the ConsoleRenderer for colorized, positional output. The JSON lines output uses our own processors to provide boilerplate log entry key-value pairs to add elements for:
- application identification by type, name, version, host, thread
- a timestamp acceptable to our ELK stack
- censoring sensitive information
- standardizing
structlogkey names to match those in other services
Each processor in the chain receives the wrapped logger object, the name of the method used to call the logger, and an event dictionary and returns the updated event dict. As an example, the add_app_info processor uses a file level BuildInfo() object (BI) to add application info to the log entry event_dict.
    @staticmethod
    def add_app_info(_, __, event_dict: dict) -> dict:
        event_dict['logGitHubRepoName'] = LogEntryProcessor._BI.repo_name
        event_dict['logServiceType'] = LogEntryProcessor._BI.service_type
        event_dict['logServiceName'] = LogEntryProcessor._BI.service_name
        event_dict['logServiceVersion'] = LogEntryProcessor._BI.version
        event_dict['logServiceInstance'] = LogEntryProcessor._HOST
        event_dict['logThreadId'] = threading.current_thread().getName()
        if LogEntryProcessor.get_request_id():
            # We are also used by the gunicorn logger so this may not be set
            event_dict['logRequestId'] = LogEntryProcessor.get_request_id()
        return event_dict
This processor helps provide a standard operations plane within our log aggregator; each service presents semantically similar information under the same keys so the information is easy to find and aggregate amongst all services.
Making logging easy
Beyond pleasant log viewing, we also want to make logging as easy as possible for the developer. If we can remove repetitive information from logging code, it’s a win.
We can start with simplifying logging in classes. It would be nice to have a shorter line of logging code and for the logger to remember the class name so you don’t have to enter it in each log entry. A LoggerMixin will do nicely here.
class LoggerMixin:
    @property
    def _logger(self):
        if not getattr(self, '__logger__', None):
            self.__logger__ = structlog.get_logger(type(self).__name__)
        return self.__logger__

    def _debug(self, msg, *args, **kwargs) -> None:
        self._logger.debug(msg, *args, level="Debug", **kwargs)

    def _error(self, msg, *args, **kwargs) -> None:
        self._logger.error(msg, *args, level="Error", **kwargs)

    def _info(self, msg, *args, **kwargs) -> None:
        self._logger.info(msg, *args, level="Info", **kwargs)

    def _warning(self, msg, *args, **kwargs) -> None:
        self._logger.warning(msg, *args, level="Warn", **kwargs)
Note that I am renaming the log levels as well, to match existing SpringBoot services in my environment so that I can aggregate log entries over all services when searching in ELK.
In the service code, every class will include the LoggerMixin:
class ContactsController(LoggerMixin):
We’ll do something similar for logging in functions:
class Logger(LoggerMixin):
    def __init__(self, name):
        """
        :param name: required logger name - use dotted package path
        """
        if name is not None and not getattr(self, '__logger__', None):
            self.__logger__ = structlog.get_logger(name)

    def debug(self, msg, *args, **kwargs) -> None:
        self._logger.debug(msg, *args, **kwargs)

    def error(self, msg, *args, **kwargs) -> None:
        self._logger.error(msg, *args, **kwargs)

    def info(self, msg, *args, **kwargs) -> None:
        self._logger.info(msg, *args, **kwargs)

    def warning(self, msg, *args, **kwargs) -> None:
        self._logger.warning(msg, *args, **kwargs)
Telemetry
The service should log each request and its parameters to allow replicating the call during debugging. It should also log the response status code and duration to support call frequency, error frequency, and duration based dashboards.
This is another task our logging system can do for the developer, while cleaning up noise in the service code.
Like many other frameworks, Falcon provides a middleware facility that has access to ingress, processing, and egress phases. This is a perfect fit for logging telemetry.
This example shows logging the ingress and egress as well as avoiding logging noise like health checks.
class Telemetry(LoggerMixin):
    def __init__(self):
        super(Telemetry, self).__init__()
        self._excluded_resources = ('/liveness', '/readiness', '/ping')

    def process_request(self, req: falcon.Request, _: falcon.Response) -> None:
        if req.path not in self._excluded_resources:
            req.context['received_at'] = datetime.now()
            req.context['body_json'] = {}
            if req.content_length:
                req.context['body_json'] = json.load(req.bounded_stream)
            self._info("Request received",
                       logCategory='apiRequest',
                       reqReferrer=', '.join(req.access_route),
                       reqVerb=req.method,
                       reqPath=req.path,
                       reqQuery=req.query_string,
                       reqBody=req.context['body_json'])

    def process_response(self, req: falcon.Request, resp: falcon.Response, _, __: bool) -> None:
        if req.path not in self._excluded_resources:
            status = 0
            try:
                status = int(resp.status[0:3])
            except:  # pylint: disable=bare-except
                pass # intentionally ignore

            duration = int((datetime.now() - req.context['received_at']).total_seconds() * 1000000)
            self._info("Request completed",
                       logCategory='apiResponse',
                       reqDurationMicros=duration,
                       reqStatusCode=status)
There is a trick buried in here - logging the request payload. Falcon does not cache the payload on read; after you read the payload once, it is gone. The doc explains
stream
File-like input object for reading the body of the request, if any. This object provides direct access to the server’s data stream and is non-seekable. In order to avoid unintended side effects, and to provide maximum flexibility to the application, Falcon itself does not buffer or spool the data in any way.
What? I could find no other clarification for this design decision. One could guess this omission is for applications that receive large payloads to avoid memory bloat; those apps may prefer to operate on streams or write it to file. This seems pretty weak, there are a few obvious work-arounds to avoid the downsides.
Anyway, we think it is critical to log the body on ingress so we can replicate failed calls while debugging. So, how do we read the body, log it, and yet still have it available to rest of the app?
The Falcon Request object has a dict-like context, so we can cache the payload there ourselves and remember to get payloads from the context throughout the rest of our app:
            req.context['body_json'] = {}
            if req.content_length:
                req.context['body_json'] = json.load(req.bounded_stream)
x-request-id
In ELK, we would like to view all log entries made during handling a single task. There is a convention for this; the x-request-id header. The concept is: when the frontend issues a request to the backend, it attaches an x-request-id header containing a uuid4. The backend attaches this value to each log entry. If the backend makes calls to other services, it includes the x-request-id header in the request and that service logs that value as well.
When a customer files a ticket with typically vague information, we just have to find one log entry related to that request, identify the x-request-id, and search ELK for that. This produces an ordered list of every log entry made, by every service, when handling the request.
Since we are running Falcon in request-per-thread mode, we can store the request_id in thread local storage and it will be available whenever we log. Python provides threading.local() specifically for this purpose. Since the LogEntryProcessor will use the request_id, it will own its storage:
class LogEntryProcessor:

    _TLS = threading.local()

    @staticmethod
    def get_request_id() -> str:
        if hasattr(LogEntryProcessor._TLS, "request_id"):
            return LogEntryProcessor._TLS.request_id
        return None

    @staticmethod
    def set_request_id(request_id: str) -> None:
        LogEntryProcessor._TLS.request_id = request_id
We can add another middleware to set and clean up the request_id:
class RequestId:

    def process_request(self, req: falcon.Request, _: falcon.Response) -> None:
        LogEntryProcessor.set_request_id(req.get_header('x-request-id', default=str(uuid4())))

    def process_response(self, _: falcon.Request, __: falcon.Response, ___, ____: bool) -> None:
        LogEntryProcessor.set_request_id(None)
Note: If the client does not provide an x-request-id, perhaps a direct api call, we will generate one on request ingress.
During application initialization, we’ll make that the first middleware in the chain:
def initialize() -> falcon.API:

    api = falcon.API(media_type='application/vnd.api+json',
                     middleware=[RequestId(), Telemetry()])
Dependency logging
Our service logging seems to be in good shape, but what about our dependencies?
If a library logs in some format other than JSON, and we don’t catch it, that line will be dropped during ingestion. Most libraries are frugal with logging: when they log, you should read it. There isn’t much more frustrating than working on a problem for several hours only to find that a dropped log message made the solution trivial. However, most Python frameworks and libraries don’t provide JSON lines logging. Gunicorn doesn’t, and structlog itself points you towards another framework to get a JSON lines output. But structlog has too much goodness to abandon it so easily.
Gunicorn does allow you to provide your own logging class. The only trick is that our class must be duck-type compatible with theirs. After a little reading, I was able to create this:
class GunicornLogger(object):
    """
    A stripped down version of
        https://github.com/benoitc/gunicorn/blob/master/gunicorn/glogging.py
    to provide structlog logging in gunicorn

    Add the following to gunicorn start command to use this class
        --logger-class app.common.logging.GunicornLogger
    """
    def __init__(self, cfg):
        initialize_logging()
        self._logger = structlog.get_logger('gunicorn.error')
        self.cfg = cfg

    def critical(self, msg, *args, **kwargs) -> None:
        self._logger.error(msg, *args, **kwargs)

    def error(self, msg, *args, **kwargs) -> None:
        self._logger.error(msg, *args, **kwargs)

    def warning(self, msg, *args, **kwargs) -> None:
        self._logger.warning(msg, *args, **kwargs)

    def info(self, msg, *args, **kwargs) -> None:
        self._logger.info(msg, *args, **kwargs)

    def debug(self, msg, *args, **kwargs) -> None:
        self._logger.debug(msg, *args, **kwargs)

    def exception(self, msg, *args, **kwargs) -> None:
        self._logger.exception(msg, *args, **kwargs)

    def log(self, lvl, msg, *args, **kwargs) -> None:
        self._logger.log(lvl, msg, *args, **kwargs)

    def access(self, resp, req, environ, request_time) -> None:
        pass # we don't support access logs

    def reopen_files(self) -> None:
        pass # we don't support files

    def close_on_exec(self) -> None:
        pass # we don't support files
There are two tricks in this implementation. Both require us to recognize that Gunicorn is our service’s parent; it will not inherit any of our logging configuration. We must initialize_logging() in this class.
Most of the class is a proxy for structlog with two simplifications. 12-factor apps don’t do files, so I can provide a pass implementation for those. Also, I know that I will not care about access logs - Falcon provides all the information I need to know about request origin. I can provide a pass implementation for access() as well.
To have Gunicorn use this class for logging, include it in your start command:
PYTHONPATH=$PYTHONPATH:. \
MONGO_URI='mongodb://localhost:27017/' \
gunicorn \
    --logger-class app.common.logging.GunicornLogger \
    'src.app:run()'
Epilog
I’d count that as a success. We have met all goals, have a relatively small, very clear implementation, a minimally invasive logging system, and a beautiful developer view.
If you want to see this system in action, check out the ember-falcon-mongo repo.